


Posted January 18, 2024
INDUSTRIAL SUPPLY MAGAZINE


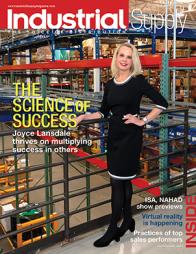
The March/April issue of Industrial Supply magazine features an in-depth cover story about Joyce Lansdale and Vallen. Plus, we're featuring articles by contributing writers Dirk Beveridge, Frank Hurtte, and David Kahle, as well as interviews with numerous product and distribution industry experts.